 PhyTrend
01Investigate · Upload
Open Investigation
How to get the fileA CSV from NASA GiovanniYou need a Time Series, Area-Averaged CSV of one variable over one box of ocean. Giovanni is free; sign in with a NASA Earthdata account.
1Choose the variableSearch chlorophyll MODIS-Aqua. Tick the checkbox, not the blue link, for Chlorophyll a concentration (water only): the Monthly row (MODISA_L3m_CHL) or the 8-Daily row (MODISA_L3m_CHL_8d_4km). Tick only one.
2Set the plotSelect Plot: Time Series, Area-Averaged. Dates: 2002-07-04 to the latest month. Region: paste a box as West, South, East, North.
3Run itClick the green Plot Data button. Monthly takes about a minute; 8-day takes a few.
4DownloadAbove the chart, choose Download ▾ → CSV. Avoid the “Downloads” link in the left panel; it often shows “no data available”.
5Drop it herePhyTrend reads the box and dates from the file, and treats −32767 (cloud, ice or polar night) as missing.
Boxes to try
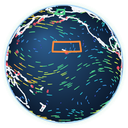
Region Time step Box (W, S, E, N) North Pacific Gyre Monthly -170,20,-140,30Barents Sea Monthly 20,70,60,80Chukchi Sea Monthly -180,66,-157,75Kīlauea, Hawaiʻi 8-day -155,18.5,-153.5,20Hunga Tonga 8-day -176,-22,-174,-20Kasatochi 8-day -155,48,-135,58Raikoke 8-day 155,45,170,55
For temperature instead, search sea surface temperature MODIS-Aqua and tick Sea Surface Temperature at 11 microns (Day), Monthly 4 km. To make another file, click Back to Data Selection: your settings are kept, so usually only the box changes. Open NASA Giovanni ↗
-170,20,-140,3020,70,60,80-180,66,-157,75-155,18.5,-153.5,20-176,-22,-174,-20-155,48,-135,58155,45,170,55Input your own ocean
Figure IYour series, yearly, with the seasons removed and Sen’s slope dashed.
Spikes and possible eruptions
Download any area-averaged time series from the NASA Giovanni website and upload the .csv here. The detector reads the file’s region, runs the tests and searches the eruption database for volcanic activity that the spike could be attributed to.
02Investigate · Search the record
The Trend Detector
What is changing, and is it real?
In simple terms
If the numbers were just random noise, how often would they still line up into a slope this steep? ‘Significant’ means less than 1 time in 20. A p-value of 0.017 means about 2 times in 100.
Select a variable and a region. The detector removes the seasonal cycle, fits a trend through the annual values and reports how it is changing and whether that change is statistically significant. Green means the trend is very unlikely to be luck; grey means it is uncertain.
01How it works · The lid
How it works
Sunlight from above, nutrients from below
In simple terms
Phytoplankton need two main inputs: sunlight from above and food (nutrients) from below. Stratification, the divide between layers of water, means warm water floats on top of cold water, as if it were a lid. Salt matters too: melting ice is fresh, so it is lighter than seawater and forms a lid of its own. Near the tropics, this lid is thicker, so less food can rise to the surface, whereas in the Arctic, melting ice lets in light. Notwithstanding, volcanoes can produce similar, and even harsher, effects, so they have to be separated from the longer-term trend.
Phytoplankton: from the Greek phytón, ‘plant’, and planktós, ‘wandering’. The drifting plants.
These plants depend on a single arrangement: sunlight from above, nutrients from below, and a layer of warm water between them that acts as a lid. Since 2002, that lid has tightened over the Pacific, where chlorophyll has fallen 4.3 per cent per decade, and lifted in the Arctic, where it has risen 16.4 per cent. However, a volcano can rupture it in a week.
The trend detector that we built, on 23 years of MODIS-Aqua ocean colour, operates on the basis of four fundamental questions: what is changing, where, by how much, and whether that change is a trend or an anomaly attributable to a volcanic eruption, based on NASA’s Multi-Satellite Volcanic SO₂ database.
02How it works · Method
Trend Isolation
What remains when the seasons are removed?
Figure IIINorth Pacific Gyre chlorophyll, 2002–2025. Raw: every winter peak and summer low. Seasons removed: each month against its own average (faint line), and the yearly means used for the trend (dots).
Log scale. Chlorophyll spans orders of magnitude, from 0.04 mg/m³ in the gyre to over 3 in an Arctic bloom, so each series was log-transformed. A change from 0.04 to 0.08 then counts the same as one from 2 to 4: a doubling.
Seasons. Spring blooms and winter lows repeat every year, so they say nothing about change. We subtracted each calendar month’s average from that month, leaving only how unusual each month was, then averaged those into one value per year.
Tests. The Mann-Kendall test seeks to find out whether there is a monotonic upward or downward trend in a variable, by comparing every pair of years and counting how often the later year is higher. Should rises far outnumber falls, the trend is unlikely to be dictated by chance alone. Sen’s slope takes the median of every year-to-year slope, so single extreme years, such as volcanic bloom events, cannot drag the rate.
S counts rises minus falls across every pair of years; β is Sen’s slope. Its 95% interval comes from the ranks of the pairwise slopes, and the p-value from the normal approximation to S, with ties corrected.
03How it works · Limits
Limitations
Where could this mislead?
Record length. Twenty-three years is short for chlorophyll, which swings with El Niño from year to year. Studies suggest 30 to 40 years are needed to separate a climate trend from this natural variability, so the gyre decline is early evidence; an expanded record would make it more reliable.
Arctic satellite bias. Arctic rivers carry coloured dissolved organic matter, which absorbs light much like chlorophyll. In simple terms, the satellite can mistake river water for plants and overestimate chlorophyll near the coast.
04How it works · Sources
Data and sources
Where every number comes from
Datasets
- MODIS-Aqua Level-3 chlorophyll-a (MODISA_L3m_CHL, R2022.0), monthly and 8-day, 4 km, area-averaged in NASA Giovanni.
- MODIS-Aqua Level-3 sea surface temperature, 11 µm day (MODISA_L3m_SST), monthly, 4 km.
- NSIDC Sea Ice Index, version 4 (G02135), regional monthly extent for the Barents and Chukchi Seas.
- Multi-Satellite Volcanic Sulfur Dioxide L4 Long-Term Global Database, version 4 (MSVOLSO2L4), NASA GES DISC, doi:10.5067/MEASURES/SO2/DATA405.
Volcanic blooms in the literature
- Wilson, S. T., Hawco, N. J. et al. (2019). Kīlauea lava fuels phytoplankton bloom in the North Pacific Ocean. Science 365, 1040–1044.
- Hamme, R. C. et al. (2010). Volcanic ash fuels anomalous plankton bloom in subarctic northeast Pacific. Geophysical Research Letters 37, L19604.
- Barone, B., Letelier, R. M., Rubin, K. H. and Karl, D. M. (2022). Satellite detection of a massive phytoplankton bloom following the 2022 submarine eruption of the Hunga Tonga-Hunga Ha‘apai volcano. Geophysical Research Letters.
01Trends · Tropics
The Tightening Lid
Why is the North Pacific Gyre losing its plants?
Figure IVGyre chlorophyll, yearly, vs normal ·
Figure VGyre sea surface temperature, yearly, vs normal ·
Between 2003 and 2025, the surface of the North Pacific Gyre warmed by 0.30 °C per decade (p = 0.006), while its chlorophyll fell by 4.3 per cent per decade (p = 0.017). A warmer surface is lighter, so it resists mixing with the cold, nutrient-rich water beneath it, and less food reaches the surface.
Year to year, the two move only loosely together (r = −0.33, not significant), as El Niño and eddies add noise. The link shows in the long-run trends, not in every single year.
02Trends · Arctic
Arctic Divergence
Is the same warming feeding the north?
Figure VIaChukchi Sea chlorophyll, May–September ·
Figure VIbChukchi Sea ice extent, yearly mean ·
Figure VIcBarents Sea chlorophyll, April–September ·
Figure VIdBarents Sea ice extent, yearly mean ·
Sea ice blocks sunlight. As it retreats earlier each year, phytoplankton get a longer growing season. In the Chukchi Sea, chlorophyll rose 16.4 per cent per decade (p = 0.001); in the Barents Sea, 5.9 per cent, not yet significant (p = 0.27).
| Region | Variable | Years | Sen’s slope | 95% interval | Mann-Kendall p | Verdict |
|---|
Table I · Every trend on this site, computed live in your browser from the data files. Chlorophyll in per cent per decade; temperature in °C; ice in thousand km².
03Trends · Volcanoes
The Volcanic Rupture
Can an eruption be told apart from a trend?
Volcanic ash carries iron, the missing ingredient across much of the ocean, while lava entering the sea can lift deep, nutrient-rich water to the surface. For each eruption, we compared chlorophyll in the weeks afterwards with the same weeks in every other year, a placebo test borrowed from event studies in finance. Kīlauea and Tonga were the highest of any year; Kasatochi was second; Raikoke, fifth. Together, p ≈ 0.008.
μ and σ are the mean and spread for the same 8-day period in all other years. The test-window mean of z is ranked against the same window in each of the n other years; k is the number of years that scored as high or higher.
| Eruption | Mechanism | Box | Peak | Peak date | Rank | Placebo p |
|---|
Table II · Peak is the highest 8-day chlorophyll in the test window relative to normal. Eruption dates and SO₂ masses from NASA’s MSVOLSO2L4 database.